Abstract
Introduction- This study investigates the energy performance, carbon emissions, and thermal comfort implications of proposed building modifications for the London Business School E-Wing building. With the increasing demand for sustainable building practices, understanding the impact of various modifications is crucial.
Objective– The primary aim is to evaluate the potential for reducing energy consumption, mitigating carbon emissions, and enhancing indoor environmental quality in educational institutions through strategic building upgrades.
Methodology– A detailed building energy model was developed using the IES-VE software to model both existing and proposed E-Wing building scenarios. The model considers factors such as heating and cooling systems efficiency, lighting, and window characteristics.
Results– The analysis revealed significant opportunities for energy savings, with proposed modifications demonstrating a potential reduction of 17.4% in energy consumption compared to the existing building. Further enhancements, such as window upgrades, could lead to a 25.8% decrease in energy usage from the baseline. Carbon emissions analysis indicated an estimated 8.2% potential reduction in emissions for the proposed building, underscoring the environmental benefits of sustainable building practices. Thermal comfort assessments showed a 13% potential increase in acceptable comfort levels and a 5% decrease in unacceptable thermal comfort hours during occupied times, particularly in lecture and seminar rooms.
Conclusions– The study concludes that even when dealing with old buildings with certain restrictions, strategic modifications can significantly improve energy efficiency, reduce carbon emissions, and enhance thermal comfort in educational buildings, even when increasing the cooling load.
Key Words– Building Energy Modelling; Thermal Comfort; Carbon Emissions; Sustainable Buildings, Energy Savings.
Resumen
Introducción– En este estudio se presenta la evaluación energética, emisiones de carbono y confort térmico de las modificaciones propuestas para el edificio E-Wing de la London Business School. Con la creciente demanda de prácticas sostenibles en la construcción, comprender el impacto de diversas modificaciones es crucial.
Objetivo– El objetivo principal es evaluar el potencial para reducir el consumo de energía, mitigar las emisiones de carbono y mejorar la calidad ambiental interior en instituciones educativas mediante mejoras estratégicas en los edificios.
Metodología– Se desarrolló un modelo detallado utilizando el software IES-VE para modelar el escenario existente como para el propuestos del edificio. El modelo considera factores como la eficiencia de los sistemas de calefacción y refrigeración, la iluminación y las características de las ventanas.
Resultados– Las modificaciones propuestas podrían reducir el consumo de energía en un 17.4% y las emisiones de carbono en un 8.2%. Actualizaciones adicionales, como las ventanas, podrían disminuir el uso de energía en un 25.8%. Además, se aumentaría el confort térmico en un 13% y se reducirían las horas de incomodidad en un 5%.
Conclusiones– El estudio concluye que aun cuando se tienen edificios antiguos con ciertas restricciones, si se realizan modificaciones estratégicas estos pueden mejorar significativamente la eficiencia energética, reducir las emisiones de carbono y mejorar el confort térmico en edificios educativos aun cuando se aumente la carga de enfriamiento.
Palabras clave– Modelización Energética de Edificios; Confort Térmico; Emisiones de carbono; Edificios sostenibles, ahorro energético.
I. INTRODUCTION
The pursuit of sustainable building practices has become increasingly imperative in addressing the environmental challenges posed by urbanisation and climate change [1]. Buildings are estimated to account for a substantial portion of global energy consumption and carbon emissions, highlighting the urgent need to address their environmental impact [2]–[4]. Consequently, there has been a growing recognition within both academia and industry of the critical role that energy-efficient building design plays in mitigating these environmental pressures [4], [5]. Alongside energy efficiency, the importance of optimising thermal comfort performance has also gained relevance, recognising its significance in ensuring occupant well-being and productivity within built environments.
Research studies evaluating energy savings, carbon emissions, and thermal comfort in buildings play a pivotal role in advancing sustainable building practices and mitigating environmental impacts [6]. By assessing the potential effectiveness of energy-saving interventions, such as renewable energy integration, energy-efficient systems, and thermal comfort optimisation strategies, researchers aim to inform policy decisions, guide building design and operation practices, and contribute to global efforts to combat climate change [1].
Several key parameters significantly impact the performance of buildings, influencing factors such as energy efficiency, thermal comfort, and environmental sustainability. Building orientation and design play a crucial role in affecting solar heat gain, natural lighting, and ventilation [7]. Moreover, the choice of building materials and insulation levels also greatly influences energy consumption and thermal performance [5], which highlights the need for new building materials [8], [9]. For instance, Marincu et al. [5] highlighted the importance of the building shape on the heating demand and concluded that lower Area to Volume (A/V) ratios positively affect the heating demand whereas the wall insulation thickness is more relevant for high A/V.
The thermal environment in buildings directly affects the building energy consumption and thermal comfort [10], [11]. Moreover, the energy consumption in a building influences thermal comfort and carbon emissions through heating, cooling, and ventilation systems [12]. Improving energy efficiency in equipment and building envelopes enhances thermal comfort while reducing carbon emissions. Conversely, inefficient systems can lead to discomfort and higher emissions. Therefore, appropriate dimensioning and selection of the heating and cooling systems are mandatory to reduce energy consumption in buildings.
Modelling tools are necessary to simulate the complex energy transport phenomena in buildings and optimise their design, energy efficiency, and sustainability [13], [14]. In recent years, various machine learning models have been developed for predicting energy consumption and thermal comfort in buildings [15]–[18]. These models consider factors such as building envelope materials [19]–[21], windows-to-walls ratio [22], insulation characteristics [19], window design and characteristics [19], [20], [23], and heating, ventilation and air-conditioning systems characteristics and setpoint conditions [17], [20], [22], [24], [25], lighting [26], among others. For instance, Wang et al. [27] addressed the optimization of thermal comfort and carbon emissions in large-space public buildings using a hybrid machine-learning model based on the one-year monitoring data. The authors emphasised the performance of the model over human decision-making, demonstrating a notable enhancement of 29% in thermal comfort and a decrease of 386.9 kgCO2 in carbon emissions for the given case study. Wei et al. [19] investigated the effectiveness of an energy building and generic algorithms models in optimising energy consumption in a historic building. It was observed from the model outputs that the wall and roof insulation together with the glass transmissivity are key to achieving the proposed energy-saving and carbon emissions goals. Chen and Tsay [17] emphasised that the cooling and heating setpoints, along with the infiltration rate, are the key factors significantly influencing their algorithm-based prediction model for carbon emissions and thermal comfort in the office building examined in their case study. Salimi et al. [28] devised a multi-objective model to assess design strategies aimed at ensuring thermal comfort during sleeping hours, with energy consumption and discomfort levels as control objectives. The authors argued, based on their findings, that the design of buildings should also account for thermal comfort during sleeping hours. Yu and Ho [22] evaluated the impact of the ventilation and lighting systems on electricity consumption, carbon emissions and thermal comfort in an office building located in Hong Kong. The energy-plus software was used in this study, and results showed that the ratio of windows to walls (WWR) plays a substantial role in facilitating natural ventilation and maximising daylighting effectiveness in perimeter areas. Findings also suggest that an ideal WWR, enhancing both natural ventilation and daylighting, translates into sustainability benefits, yielding carbon reduction rates of 6.31% to 9.21% and enhancing thermal comfort levels by 10% to 30%. Moreover, El-Bichri et al. [21] evaluated their performance of construction materials for energy efficiency and indoor thermal comfort in a hot, semi-arid climate using the TRNSYS software. The dynamic simulations developed assessed four houses constructed with different materials: Cinder Blocks, Reinforced Concrete, Fired Bricks, and Rammed Earth. The authors concluded that the rammed earth house exhibited annual heating/cooling loads 23%, 11%, and 3% lower than reinforced concrete, cinder blocks, and fired bricks, respectively. Also, the authors noted that the implementation of shading and night natural ventilation techniques reduced these thermal load differences to 51%, 24%, and 5%, respectively.
An extensive analysis investigated a range of factors impacting building energy efficiency, including controls for heating, cooling, ventilation, lighting, and shading levels [29]. The literature revision showed that shading levels impact heating, cooling, and lighting energy consumption, while effective control strategies could yield significant energy savings in these parameters and provide high thermal comfort levels [30], [31]. Specifically, lighting control demonstrated potential savings of up to 91% in lighting energy, while ventilation control could achieve up to 85% energy savings in fan energy and up to 49% energy savings in HVAC energy. Moreover, heating and cooling control strategies can offer potential savings of up to 37% energy saving in HVAC energy consumption [29].
Finally, Pan et al. [32] emphasised the key role of building performance simulation in shaping the future landscape of the architectural sector. Therefore, the literature revision recognizes that each study underscores the importance of tailored approaches to building design and operation, highlighting the unique contextual factors influencing energy consumption and indoor environmental quality.
Building energy-saving programs are crucial for reducing energy consumption and mitigating carbon emissions, contributing to environmental sustainability [33]. Government incentives are crucial for motivating participation by encouraging the adoption of more efficient technologies and the integration of renewable energy sources, thereby ensuring long-term success [34].
Educational buildings are of special interest due to their social impact. Refurbishment projects on educational buildings are crucial for enhancing energy efficiency, particularly by assessing the impact of key parameters affecting energy use. By prioritizing refurbishment based on specific energy consumption, these projects can significantly reduce energy use. Improving thermal insulation, replacing windows, and modernizing heating systems are essential measures [35]. Such projects not only lower energy costs but also improve the quality of educational environments.
Initiated in 2024, the present study was motivated by a growing need for educational institutions to align with global sustainability goals. Buildings, particularly older structures, are significant contributors to energy consumption and carbon emissions. The E-Wing building of the London Business School, with its unique architectural features and substantial daily usage, presents an ideal case for this exploration. This research paper explores the intersection of energy-efficient building design and occupant comfort assessment, focusing on the E-Wing building at the London Business School. A detailed building energy model is developed to capture the performance metrics for both existing and proposed E-Wing building scenarios. By investigating the effectiveness of proposed building modifications and sustainability initiatives, this study aims to evaluate the potential of reducing energy consumption, mitigating carbon emissions, and enhancing indoor environmental quality in the mentioned educational institution and provide insight to similar built environments.
II. METHODOLOGY
This section provides the details of the methodology employed in the present study. It includes the description of the project location, building specification, model details, assessment indicators description, and considerations.
A. Location of the building
The present study focused on assessing the energy-saving potential, carbon emissions, and thermal comfort in an educational establishment. The building involved in the study was the E-Wing of the London Business School.
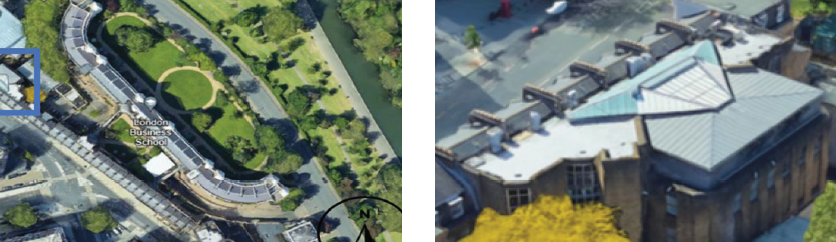
Fig. 1. Location and image of the LBS E-Wing.
Source: [36]
The E-Wing building can be found within the urban campus of the London Business School, located in northwest London, in front of the Regents Park, UK (see blue mark in Fig. 1). The building’s setting is characterised by its dense urban environment, which influences various microclimatic conditions such as wind patterns and urban heat island effects. The proximity of other structures to the building, its orientation, and the local urban landscape all play significant roles in its thermal performance and energy usage.
B. Main characteristics of the building
The E-Wing of London Business School presents a diverse architectural composition. The building comprises a variety of room categories, each fulfilling specific functions. The E-Wing building of London Business School spans five stories, extending from the basement to the third floor (see Fig. 2). Erected in the 1980s, the building features a reinforced concrete framework. Although minor renovations have occurred periodically, the original architecture persists. Its Gross Internal Area (GIA) measures around 2400 m², equating to roughly 480 m² per floor.
Fig. 2. (a)-(f) Drawings of the existing E-Wing building.
Source: Authors
Fig. 2 illustrates the current layout of floor configurations, utilising a colour-coded scheme to delineate the air conditioning status across different zones. Each colour represents a specific conditioning setup as detailed below:– Purple signifies tempered mechanical ventilation provided by Air Handling Units (AHUs) and Fan Coil Units (FCUs).
- Orange denotes tempered mechanical ventilation from AHU, FCUs and Radiators.
- Pink represents hybrid ventilation systems, which combine natural supply with mechanical extraction, supplemented by refrigerant FCUs.
- Yellow indicates natural ventilation paired with radiators.
- Green refers to a mechanical extract ventilation system complemented by radiators.
The E-Wing building comprises diverse room categories, each employing distinct conditioning methods. The main room types include seminar rooms, offices, lecture halls, restrooms, lounges, dining areas, and circulation spaces encompassing stairwells and corridors. In the existing configuration, only spaces highlighted in purple, orange, and pink are climate-controlled zones that receive air conditioning via Air Handling Units (AHUs) or Fan Coil Units (FCUs). Conversely, the proposed scenario envisages an expanded air-conditioned coverage to additionally include spaces such as lobbies, foyers, restrooms, and the kitchen.
Building occupancy and activity levels fluctuate seasonally, with operations spanning all seven days of the week, including public holidays. System operating schedules are tailored to accommodate the range of activities hosted within the building. Currently, the air handling unit operates from 7 am to 10 pm on weekdays to regulate ventilation, heating, and cooling ahead of teaching sessions. Seminar rooms, distributed across all floors from the basement to the third level, experience periodic utilisation throughout the day. Given the consistent room occupancy levels, ventilation, cooling/heating, and lighting systems are anticipated to remain active continuously to meet demand.
The basement plant room, which houses an Air Handling Unit (AHU), can be found in the main plant room in the basement. This unit is pivotal in supplying fresh air across various zones, including lecture theatres, seminar rooms, and offices. Complementing this, additional AHU mixing chambers are deployed, particularly targeting conditioned air delivery to lecture theatres on the ground, first, and second floors. The lecture theatre on the third floor is equipped with a dedicated condenser unit situated on the roof, facilitating independent heating and cooling operations for the space. Additionally, Fan Coil Units (FCUs) are utilised in numerous teaching, and seminar areas throughout the building to provide cooling.
Across the building, circulation spaces, restrooms, and seminar rooms are equipped with radiators for heating purposes. These radiators are supplied by a boiler located in the A-Wing building and routed to the E-Wing building. Furthermore, the chilled water (CHW) and low-temperature hot water (LTHW) utilised by the basement Air Handling Unit (AHU) originate from other London Business School (LBS) buildings and are directed to the E-Wing basement. Additionally, a rooftop fan is used to extract air from the restrooms on all levels.
Heating in the building is primarily provided through radiators located in circulation areas, restrooms, and seminar rooms. Additionally, Variable Refrigerant Flow (VRF) split systems are installed across numerous teaching, working, and relaxation spaces to cater to cooling needs.
The lighting infrastructure within E-Wing presents a combination of LED and fluorescent fittings. A policy of gradual upgrading is in place, where fluorescent lights, upon reaching their economic life expectancy, are being systematically replaced with more energy-efficient LEDs.
The building’s operations are integrated into a site-wide Building Management System (BMS), providing centralised control and monitoring for all buildings within the London Business School campus. The building energy management is streamlined through an Advanced Metering & Targeting (AM&T) system. This platform enables detailed monitoring of energy consumption, with the capability to segregate usage data by individual buildings. Such tracking is instrumental in identifying patterns of energy use and potential areas for efficiency improvements.
C. Model description
This study employs Dynamic Simulation Modelling (DSM) to provide an in-depth analysis of energy performance, carbon emissions, and thermal comfort within a university building under two scenarios: the existing design conditions and a proposed scenario including various modifications.
The dynamic thermal model of the E-Wing incorporates the climate data to simulate external weather conditions that the building is likely to encounter. The climate data of the city of London was obtained from the UK Meteorological Office [37]. This data, processed at hourly intervals, includes critical variables such as air temperatures, wind speed and direction, and air pressure, amongst others.
The E-Wing building model was developed using the Integrated Environmental Solutions Virtual Environment software (IES-VE). This software allows incorporating factors like solar radiation, HVAC systems, occupancy patterns, lighting control, and thermal performance of materials. It employs finite element methods (FEM) and computational fluid dynamics (CFD), essential for analysing the thermal behaviour of building materials and the internal heat movement. More information about the software can be found in [38].
The dynamic model of the E-Wing requires various assumptions, which were based on a combination of empirical data and standard industry practices. Therefore, the building envelope was modelled considering the known U-values and fabric air permeability. Table 1 outlines the main building parameters in terms of the overall heat transfer coefficient. Specific U-values for different parts of the building were incorporated, ranging from 0.16 W/m².K for the new zinc roof to 3.00 W/m².K for the existing external glazing. The fabric air permeability was set at 15 m³/m².h at 50Pa, a standard value for buildings of similar age and construction. Material thermal performance was assumed to be stable over time, ensuring consistency in the model’s predictions.
Table 1.
Defined main building characteristics
|
Element
|
Unit
|
Value
|
|
Air Permeability (Non-Domestic)
|
m³/m².h at 50 Pa
|
15
|
|
External Wall U-value (Existing Park Road)
|
W/m².K
|
1.78
|
|
External Wall U-value (Existing Sussex Place)
|
W/m².K
|
0.18
|
|
Basement Contact Floor U-value
|
W/m².K
|
0.467
|
|
Roof U-value (Existing Park Road)
|
W/m².K
|
0.37
|
|
Wall & Roof U-value (Existing Zinc & Sussex Place L03)
|
W/m².K
|
0.20
|
|
Roof U-value (Existing Flat)
|
W/m².K
|
0.34
|
|
Roof U-value (New Zinc)
|
W/m².K
|
0.16
|
|
External Glazing U-value (Existing)
|
W/m².K
|
3.00
|
|
External Glazing U-value (New)
|
W/m².K
|
1.5
|
|
Rooflights U-value (New)
|
W/m².K
|
1.6
|
Source: Authors
The study was carried out considering the ASHRAE standards for energy efficiency in existing buildings [39] and the CIBSE guidelines [40], ensuring compliance with industry standards.
The DSMs were utilised to assess compliance with the Approved Document Part L2A 2021 [41], employing the National Calculation Methodology [42]. This standard provides a framework for evaluating the energy efficiency of non-domestic buildings and is essential for ensuring regulatory compliance.
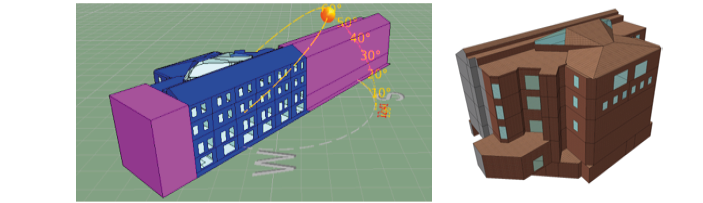
Fig. 3. LBS E-Wing Model Images.
Source: Authors
A picture of the building model is shown in Fig. 2f and Fig. 3 (Building under study in blue colour). The three-dimensional model used simplified geometries where detailed architectural features were not critical to the overall thermal performance. For the development of the model, the building orientation, window-to-wall ratio, and internal layout were considered. This model includes the architectural, mechanical, and electrical systems to ensure a holistic representation. The surrounding buildings (buildings in pink colour) were also incorporated into the model, albeit in a simplified form, to gauge their impact on the subject building’s energy performance and thermal comfort levels.
D. Proposed Modifications
Considering the energy consumption measurements, carbon emission estimations, and operational costs. The proposed modifications are aimed at enhancing these aspects through the following interventions:
Introduction of new, energy-efficient Air Handling Units (AHUs) to replace or augment the existing setup, aiming to improve air quality and energy usage efficiency in ventilation.
Replacement of existing VRF systems using old refrigerant with new, more effective R32 units, which have a significantly lower Global Warming Potential (GWP) of 675 compared to traditional refrigerants [43].
Introduction of new, more effective radiators, aimed at improving the heating efficiency of the building and reducing energy consumption in maintaining thermal comfort.
Replacement of existing windows on the north-eastern side (Sussex Place) and roof light with advanced, energy-efficient models. This initiative also includes the installation of new roof lights equipped with intelligent controls and passive ventilation features, enhancing natural light utilisation and reducing reliance on artificial lighting.
A full transition to LED efficient lighting, accelerating the existing policy of replacing fluorescent fittings. This change is expected to offer substantial energy savings and reduce maintenance costs.
The proposed system upgrades will be seamlessly integrated into the existing site-wide Building Management System, ensuring operation and monitoring capabilities for these new installations. This integration is vital for maintaining a cohesive and efficient building management strategy.
These proposed changes collectively aim to position London Business School E-Wing as a model for sustainable and efficient building design, reflecting the institution’s commitment to environmental stewardship and operational excellence.
To accurately assess and enhance the building fabric, it has relied upon data provided by the project architects. This data includes detailed fabric performance parameters, essential for our analysis. However, it is noteworthy that certain sections of the building lack specific U-values, a measure of thermal transmittance. In such cases, it has been applied standard principles aligned with the established performance metrics.
E. Considerations
In developing dynamic models of the building, assumptions were made regarding geometry, plant efficiency, and building fabric. Where specific plant information was not available, default National Calculation Methodology (NCM) values were used.
Due to complex or non-planar geometries, some architectural features have been simplified. The building fabric information has been based on the age of the building and known values.
Table 2 shows the number of people per room. It was considered a people density of 10 m²/person for communal areas and unlisted areas in Table 2. The sensible and latent gains per person were set at 90 W and 60 W, respectively. Lighting consumption was modelled at 8 W/m² for the existing building and 3 W/m² for the proposed design considering LED lighting and the CIBSE Guide A, Internal heat gains [44]. The infiltration rate was set at 0.25 air changes per hour (ACH), with auxiliary ventilation at 10 l/s/person.
The model included specific coefficients of performance for Space Heating Radiators and Fan Coil Units. Space heating radiators with efficiency of 0.85 were included. The space heating Fan coil unit was also included considering a COP of 2.5. The Air Handling Units (AHU) were modelled with specific fan power, aligning with the latest efficiency standards. The AHU-specific fan power was established at 2.6 W/(l·s) for the existing building and, 2.0 W/(l·s) for the proposed case.
In the case of the temperature settings: it was set at 19 °C for heating and 23 °C for cooling. Regarding the weather data for estimating heating loads, the outdoor design dry-bulb and wet-bulb temperatures were set to -4°C. Regarding the weather data for estimating cooling load, an outside maximum dry-bulb temperature of 31.5 °C and a wet-bulb of 19.9 °C were considered. Finally, the hot water systems in the point of use (direct consumption) were considered by setting an efficiency of 100%. Regarding the small power equipment, it was considered 2 W/m2 for the lecture theatres, and 5 W/m2 for seminar rooms (CIBSE Guide A, Internal heat gains) [44].
As future products for the building have not been selected, the proposed modifications and future product selections were modelled to comply with Part L 2021 [45], ensuring that the building would meet current and future energy efficiency standards.
We acknowledge that the performance of building fabrics might vary slightly over time due to factors like weathering and maintenance. However, for this study, it was assumed that these changes are minimal and do not significantly impact the overall energy efficiency and thermal comfort of the building.
The specified fabric parameters will be utilised in calculating the building’s carbon emissions and thermal comfort levels, forming a critical part of the energy-saving potential evaluation.
Table 2.
Number of people per room
|
Room
|
# People
|
|
Ground floor lecture theatre
|
93
|
|
Level 1 lecture theatre
|
59
|
|
Level 2 lecture theatre
|
30
|
|
Level 3 lecture theatre
|
42
|
|
Lower-ground seminar rooms
|
6
|
|
Ground floor seminar rooms
|
7
|
|
Level 1 seminar rooms
|
7
|
|
Level 2 seminar rooms
|
6
|
|
Level 3 seminar rooms
|
5
|
|
Lover ground lounge
|
30
|
|
Lover ground prayer room
|
10
|
|
Level 2 eating area
|
30
|
|
Level 3 office
|
3
|
Source: Authors
The next indicators were selected to assess the building performance:
Operational energy consumption: This includes the energy consumption due to heating, ventilation, and air conditioning (HVAC) systems, lighting, and other energy-consuming elements within the building.
Carbon Emissions: This involves calculating emissions resulting from energy consumption, considering the energy coming from both grid-supplied and renewable sources in the UK context.
Thermal Comfort: Thermal comfort is a critical aspect of building performance. The DSMs are employed to simulate indoor thermal conditions, considering factors like air temperature, humidity, and air movement. This analysis helps in identifying areas within the building that may require design modifications to enhance occupant comfort.
The thermal comfort analysis was based on CIBSE Guide A: Environmental Design, utilising indices like Predicted Mean Vote (PMV) and Predicted Percentage of Dissatisfied (PPD), derived from ISO 7730 [46]. Considering the above mentioned, the energy modelling adheres to CIBSE Guide F: Energy Efficiency in Buildings, providing a framework for sustainable building design [47].
III. RESULTS AND DISCUSSION
This section provides the main results from the energy, carbon emission, and thermal comfort characterization of the E-Wing building of the London Business School. Firstly, the energy and carbon emission analysis for the existing building and proposed case are presented. Subsequently, the analysis focuses on the thermal comfort study in different areas of the selected building.
F. Energy and carbon emissions analysis
The energy used to operate the E-Wing building comes from factors such as heating, cooling, hot water, ventilation, equipment, and lighting. The developed building energy model captures the building performance for energy, carbon, comfort, and loads. This is based on an extensive range of predictive simulation results for building systems, zones, rooms, and surfaces over hourly to annual profiles. The model was simulated using the building’s maximum occupancy capacity and operational hours. It was not based on current electricity and gas bills for the E-Wing building. The maximum energy usage over a year during full occupancy and operational hours for the E-Wing building has been calculated for the existing building and the proposed building (See Fig. 4).
Fig. 4a includes all sources of energy e.g., electricity and natural gas. According to Fig. 4a, the maximum peak energy usage for the existing building was around 690 MWh per year, while it was around 570 MWh per year for the proposed case.
The London Business School supplied the electricity for E-Wing over a year from November 2021- 2022. The actual operational consumption of electricity over this period was around 261 MWh. To estimate the total energy consumption, all other sources of energy in the building need to be measured. For the E-Wing building, this would include the addition of natural gas usage. As the E-Wing building uses natural gas for areas of heating, the figure for total operational energy consumption would be increased compared to the 261 MWh reported only for electrical energy. In this case, there was no data available regarding the energy consumption due to natural gas usage.
Fig. 4 (a) Maximum peak energy usage over a year, and (b) Comparison of the estimated peak energy consumption per month for the existing and proposed building.
Source: Authors
When comparing the actual E-Wing building energy usage to that from the model of the existing building, it can be expected to obtain a higher modelled energy usage given that peak conditions were established for the simulation. According to the 2018 DEC (Display Energy certificate) reported for the London Business School [48], there is a 50/50 split between electricity and natural gas usage. The report of 2022 also showed a similar split (around 49/51) for the Plowden building at London Business School [48]. From this data, a comparison can be made between the modelled existing building energy usage and the actual energy usage of the building.
The maximum energy usage (due to natural gas and electricity) of the modelled existing building was 690 MWh per year. On the other hand, using the 50/50 split, the actual energy consumption for the E-Wing building including natural gas and electricity can be estimated at around 522 MWh (261 MWh only from electrical energy). This value is likely to be the actual energy usage and not the maximum usage. A full-capacity building with 100% occupancy during all working hours gives a maximum usage, not the actual usage. Given that the building is not at full capacity 100% all the time, the actual building energy usage can be reasonably approached as 75.6% of the maximum building energy usage (522 MWh of 690 MWh). In the case of the proposed case, the peak energy usage was around 570 MWh, while the energy usage of the building at a normal capacity can be approached as 430.92 MWh per year. This represents a drop of around 17.4% in the total energy usage for the proposed case in comparison to the existing building.
Modelling of current energy usage and emission profiles requires a real-life occupancy profile, HVAC usage, and lighting control data collected over a year. However, as seen in the proposed case, the building could consume less energy in comparison to that of the existing building. The proposed case could provide a 17.4% drop in energy consumption. This is because the proposed modifications consider a more efficient HVAC plant installed, efficient LED lighting, and updated windows on the Sussex place side with better fabric performance. These changes decrease energy usage monthly and annually.
The total energy consumption per month in MWh is shown in Fig. 4b. The results show that the highest energy consumption occurs during the coldest months, as opposed to the warmer ones, for both the existing and proposed building cases. Results also show that the highest energy savings potential can be achieved during the coldest months, while it is observed that more energy needs to be consumed in the proposed case during the warmest month. The data above can be explained from the information presented in Fig. 5 In Fig. 5a it can be observed that during the coldest months, the highest energy consumption is due to the heating of the spaces, followed by the energy use by the lighting, pumps and fans, for the existing building. During the warmest days, the highest energy usage is mainly for cooling, followed again by the energy use by the lighting, pumps and fans. In this case, the energy use by lighting, pumps and fans was almost constant every month, while the highest energy usage variations were found due to heating and cooling. January is the month with the highest energy demand compared to any other month, and over half of the energy used is for heating by the consumption of natural gas. From Fig. 5a it can be deduced that natural gas energy is used mainly for the heating of spaces during the winter while electrical energy is employed to drive the cooling systems, fans, interior lighting, and pumps, among other equipment.
Fig. 5 (a) Maximum energy dashboard in MWh by energy source for (a) the existing building, and (b) the proposed case.
Source: Authors
In terms of heating, a comparison between Fig. 5a and Fig. 5b shows the heating load could be globally reduced from 190.2 kW to 173.2 kW (Table 3) despite there is a larger air-conditioned area in the basement level for the proposed case in comparison to the base case, as mentioned in section 2.2. The reason for this reduction in heating load is the better control of the comfort conditions which impact positively on reducing the overheating of the spaces. However, if all the building windows are updated, it would be expected to reduce the solar gains, which would increase the heating load provided by the heating system to reach comfort conditions (See Table 3).
Regarding the cooling needs, a comparison between Fig. 5a and Fig. 5b shows that it will tend to increase during the warmest days mainly because of the larger air-conditioned area covered in the proposed case in comparison to the base case, as mentioned in section 2.2. However, it is noted that if all the building windows are updated, it would be expected to reduce the cooling needs (see Table 3) due to a further reduction in solar gains.
Since high solar gains can increase overheating in buildings, the effect of changing the windows in E-Wing on the Sussex Place side and the roof light with higher-performing glazing was specifically analysed. The proposed works on the E-Wing are set out to replace the windows on the Sussex Place side and the roof light with high-performing ones. The replacement of these windows can greatly improve the building performance as seen by the solar gain comparison presented in Table 4. It can be noted that a 28% drop (from 32 kW to 23 kW) in solar gain can be reached when comparing the existing and proposed building when partially updating the building windows for more efficient ones on the Sussex Place side. To further show the effect windows have on energy consumption another model was created on the proposed building.
The results in Table 5 show that the maximum peak energy usage can be further reduced from 570 MWh per year to 512 MWh per year if all the building windows are replaced. This represents a drop in energy usage of around 25.8% concerning the base case and a drop in energy usage of around 10.2% concerning the proposed case. Results indicate that the use of more efficient windows could help to reduce the overheating during the warmest days, then reducing the cooling needs, but it could also increase the heating needs due to the drop in solar energy gains through the windows.
Regarding the lighting gains, the proposed building is to have all the lighting upgraded to LEDs. LED lighting is highly energy efficient and produces a much lower heat gain per lumen output. The existing building was modelled with a mixture of LED and fluorescent lighting. A comparison between Fig. 5a and Fig. 5b shows that lighting is one of the most energy-consuming equipment, therefore, it could provide a high energy-saving potential. The results in Table 6 show a comparison of the lighting gain in kW over a year in the existing and proposed building. The lighting gain results show that there is a 61% drop in lighting gain for the proposed building. This indicates that the existing lighting fixtures, predominantly older fluorescent types, contribute considerably to the building energy load. The vast reduction in lighting heat gain can help to reduce overheating in the building during the warmest days but it can also increase the heating needs during the coldest days as evidenced in Table 3. The energy consumed by lighting over a year was also estimated for the E-Wing. The results show that there is a 63% drop (from 103 MWh to 38 MWh) in the lighting energy consumption in the proposed building due to the upgrade in the lighting performance (Table 6). This alone gives a 63MWh drop in the overall energy consumption for the whole building.
Table 3.
Estimated heating and cooling loads
|
Heating (H) and Cooling (C) Loads (kW)
|
|
Proposed building with all new windows
|
H: 180.5 C:136.2
|
|
Existing building
|
H: 190.2 C:96.2
|
|
Proposed building
|
H: 173.2 C:147.2
|
Source: Authors
Table 4.
Eestimated maximum solar gains
|
Maximum solar Gain (kW)
|
|
Existing building
|
32
|
|
Proposed building
|
23
|
Source: Authors
Table 5.
Estimated maximum peak energy usage
|
Maximum Peak Energy Usage (MWh)
|
|
Existing building
|
690
|
|
Proposed building
|
570
|
|
Proposed building with all new windows
|
512
|
Source: Authors
Table 6.
Estimated Annual lighting Gain and Total lighting Energy
|
Annual lighting Gain (kW)
|
Total lighting Energy (MWh)
|
|
Existing building
|
18
|
103
|
|
Proposed building
|
7
|
38
|
Source: Authors
Results indicate that improving the glazing and lighting performances reduces the heat gains during the coldest days, being the effect of the lighting update more predominant than the glazing update, which increases the heating load required from the air conditioning system. Results also indicate that improving the glazing and lighting performances could reduce the heat gains during the warmest days, then reducing the cooling needs. However, this effect was not observed between the base and proposed case mainly because the air-conditioned air was expanded to provide comfort conditions in previously non-conditioned areas.
Regarding the carbon emissions, the carbon emissions over a year during full occupancy and operational hours for the E-Wing building have been estimated for the existing building and the proposed building (See Fig. 6a).
This includes energy usage data from electricity and natural gas at full occupancy during operational hours. According to Fig. 6a, the maximum carbon emissions for the existing building was around 100 tonnes of CO2 per year, while it was around 91.8 tonnes of CO2 per year for the proposed case. Considering the partial occupancy of the building of around 75.6%, The modelled carbon emissions can be reasonably approached around 75 tonnes of CO2 per year for the existing building, while it could be around 68.85 Tonnes of CO2 per year for the proposed case. In any case, there is a drop of 8.2% in CO2 emissions per year concerning the reference case.
Moreover, Fig. 6b shows similar trends of carbon emissions to those for energy usage per month. It can be noted that carbon emissions remain low during the warm months, whereas they keep high during the cold months for both the existing and proposed building. As was the case for energy usage, the major responsible for the carbon emissions is the air conditioning system used for heating and cooling of spaces. Therefore, the major carbon emissions reduction can be reached during the cold months when the energy usage for air conditioning is the highest.
Fig. 6. (a) Carbon emissions over a year, and (b) Comparison of the estimated carbon emissions per month for the existing and proposed building.
Source: Authors
G. Thermal comfort analysis
Thermal comfort is a desired condition in which a person feels comfortable in an environment. The assessment includes conditions such as occupancy, lighting, heating, and cooling, solar gains, and controls. IES VE calculates thermal comfort using the Thermal comfort Index. The figures below show simplified parameters from the index scale which include unacceptable cold, acceptable cold, pleasant, acceptable warm, unacceptable warm and dangerous warm.
The study allows a comparison of the main conditioned areas in the E-Wing which are the lecture rooms, seminar rooms, circulation/ corridor areas, and stairs for the existing and proposed buildings (See Fig. 2). Fig. 7. presents the thermal comfort index estimation in the mentioned areas for the existing and proposed buildings. Moreover, Fig. 8 shows the breakdown of the percentage of operational hours of thermal comfort in all the areas for the existing and proposed buildings. Additionally, Fig.s 11 and 12 present the breakdown of the percentage of operational hours of thermal comfort in the lecture/seminar rooms and conditioned circulation areas, respectively, for the existing and proposed buildings.
Comparison between Fig. 7a and Fig. 7b shows that the percentage of thermal comfort is mainly pleasant in the lecture rooms, seminar rooms, and stairs of the existing and proposed building. Moreover, the percentage of thermal comfort is the mainly acceptable warm in the circulation areas. It can also be noted that the air-conditioning system of the proposed building could provide a higher percentage of thermal comfort in the pleasant and comfortable range if compared to that in the existing building. Additionally, it is observed that the improvements in thermal comfort were reached mainly in lecture and seminar rooms thanks to the better air-conditioning control system considered in the proposed case. For instance, the thermal comfort index in seminar rooms rose from 57% in the base case to 70% in the proposed case. Furthermore, the thermal comfort index in lecture rooms rose from 65% in the base case to 78% in the proposed case. Regarding the circulation areas, they can reach acceptable warm conditions around 60% in both the existing and proposed building.
All conditioned areas have been summed together in Fig. 8 to show an overview of how well the building is performing in terms of comfort as a whole. Fig. 8 indicates that the percentage of thermal comfort hours in all the air-conditioned spaces in pleasant condition was estimated at around 45% for the existing building, and improved to 52% for the proposed case. The percentage of thermal comfort hours in the acceptable warm condition was estimated around 29% for the existing building, and 30% for the proposed case. Meanwhile, the percentage of thermal comfort hours in acceptable cold conditions was reduced from 11% to 6%.
Fig. 7. Thermal comfort in selected areas for (a) the existing building and (b) the proposed case.
Source: Authors
Fig. 8. Percentage of thermal comfort hours in all the conditioned spaces for (a) the existing building and (b) the proposed case.
Source: Authors
In general, the existing building-conditioned areas perform 85% of the time at acceptable levels or above. It also means that 15% of the time, the existing building is underperforming, mostly due to overheating. In the proposed buildings, the conditioned areas perform 88% of the time at acceptable levels or above, and 12% of the time it is underperforming. The improvement in thermal comfort was possible due to the proposed upgrade in the cooling systems and control, efficient windows in the lecture rooms, and LED lighting.
Fig. 9. Percentage of thermal comfort hours in the lecture and seminar rooms for (a) the existing building and (b) the proposed case.
Source: Authors
Fig. 10. Percentage of thermal comfort hours in conditioned circulation areas for (a) the existing building and (b) the proposed case.
Source: Authors
Fig. 9 shows that the lecture and seminar room perform the best concerning thermal comfort compared to other areas, which results are shown in Fig. 10. The existing building is around 95% of the time performing at acceptable and pleasant conditions in these areas. The proposed building is around 100% of the time performing at acceptable and pleasant conditions in these areas.
In the case of the circulation areas, these spaces have been grouped as they are often open plan/within open areas. Fig. 10a and 10b show that these zones (stairs, corridors, lounge, and open-plan eating spaces) are 76% and 75% of the time performing at acceptable and pleasant conditions in the existing and proposed building. The main sub-area decreasing comfort levels are the stairwells.
H. Recommendations
Based on the study’s findings, several recommendations can be made for the London Business School and similar institutions:
The London Business School and similar institutions should prioritize ongoing investment in the latest energy-saving technologies for both new construction and retrofitting projects. By incorporating advanced insulation materials, and full LED lighting fixtures, the institution can significantly reduce energy consumption and operational costs while improving occupant comfort.
The optimal integration of energy-efficient Air Handling Units (AHUs) with advanced air filtration capabilities will substantially reduce energy consumption while improving air quality, following ASHRAE Standard 62.1-2019 [49]. A transition to Variable Refrigerant Flow (VRF) systems with low GWP refrigerants is recommended to enhance efficiency and minimize environmental impact, as specified by ASHRAE Standard 34-2019 [50].
Thermal insulation should be enhanced to exceed the U-value requirements delineated in Part L of the Building Regulations. It is advised that thermal transmittance values should aim for less than 0.16 W/m²·K for roofs and 0.18 W/m²·K for walls, as suggested by CIBSE Guide A [44]. Additionally, replacing existing glazing with high-performance triple-pane windows could achieve U-values as low as 0.5 W/m²·K, dramatically reducing heat loss, per ISO 9869-1 [51].
Encouraging the integration of renewable energy sources, such as solar panels, presents a promising avenue for further reducing the institution’s carbon footprint and is in line with the International Energy Agency’s PVPS Task 15 recommendations [52]. By leveraging on-site renewable energy generation, educational buildings can achieve greater energy independence and resilience while contributing to global sustainability objectives.
Adopting a sophisticated Building Management System (BMS) that includes real-time monitoring and predictive analytics capabilities, as outlined in ISO 50001 [53], would optimise energy usage and maintenance schedules effectively. A community engagement programme that involves educational workshops and real-time sustainability dashboards would further embed a culture of conservation, aligning with UNESCO’s goals for education in sustainable development [54]. Furthermore, the adoption of smart building technologies should be considered to dynamically adjust environmental conditions based on real-time data on occupancy and weather, maximising energy efficiency and occupant comfort, according to CIBSE TM54 [1], [6], [55].
Involving students, faculty, and staff in sustainability initiatives fosters a culture of environmental responsibility and creates a more inclusive campus community. By organizing educational programs, workshops, and sustainability campaigns, educational institutions can empower individuals to actively participate in energy-saving efforts and contribute to a greener campus environment.
Conducting extended studies to monitor the long-term performance of implemented changes is essential for evaluating their effectiveness and identifying areas for improvement. Additionally, expanding the scope of research to include comparative analyses with other university buildings allows for broader insights into best practices in sustainability and informs future decision-making processes.
The institutions should remain proactive in exploring new and emerging technologies in building energy efficiency. By staying abreast of advancements in the field, educational buildings can identify innovative solutions that offer enhanced performance and cost-effectiveness, ultimately driving continuous improvement in sustainability outcomes.
The findings of this study align with broader global sustainability goals, such as those outlined in the Paris Agreement and the United Nations Sustainable Development Goals. The reduction in energy consumption and carbon emissions from a single university building, when extrapolated to a larger scale, could contribute significantly to these international efforts.
IV. CONCLUSIONS
The present study involved a comprehensive evaluation of the energy-saving potential, carbon emission, and thermal comfort of the London Business School E-Wing building considering an existing and proposed scenario. The study included the use of IES-VE software for the development of a dynamic thermal model of the building. Results yielded insightful findings on the building’s energy usage, carbon emissions, and thermal comfort levels. The next conclusions can be highlighted:
Comparison between existing and proposed building scenarios revealed promising opportunities for energy reduction. Implementing modifications such as efficient HVAC systems, LED lighting, and updated windows demonstrates a potential energy saving of approximately 17.4%, even when increasing the cooling load. Moreover, focusing on window upgrades alone could lead to a further 10.2% decrease in energy consumption concerning the proposed case, 25.8% concerning the base case, highlighting the importance of building envelope enhancements. Moreover, It was noted nuanced effects on heating and cooling needs, necessitating a balanced approach to system optimization.
Carbon emissions for both existing and proposed building configurations were evaluated. Proposed modifications lead to an estimated 8.2% reduction in carbon emissions, primarily driven by enhanced energy efficiency measures. This underscores the importance of sustainable building practices in mitigating environmental impact and advancing climate goals.
Extensive analysis of thermal comfort across various building areas reveals notable improvements in the proposed building design. Enhanced air-conditioning controls, efficient windows, and LED lighting contribute to higher levels of thermal comfort, particularly in lecture and seminar rooms. The proposed building showed a 13% increase in pleasant comfort hours in the lecture and seminar rooms and a 5% decrease in unacceptable thermal comfort hours during occupied times. Overall, the proposed building demonstrates better thermal comfort performance compared to the existing structure, highlighting the benefits of targeted upgrades and system optimization in enhancing occupant satisfaction and well-being.
Although there is already a positive impact, the results and analysis shown can be improved further by applying more energy-saving measures. Future study recommendations include energy performance monitoring, occupant behaviour analysis, and exploration of advanced building control systems.
CRediT AUTHORSHIP CONTRIBUTION STATEMENT
Carlos Amaris-Castilla: Methodology, Formal Analysis, Visualization, Writing-Original Draft, Writing -review & editing Writing -Proofreading and Editing. Daniele Tino: Conceptualization, Methodology, Investigation, Software, modelling, Formal Analysis, Research, Visualization, Data Curation, Writing -Original Draft, Project Management.
CONFLICTS OF INTEREST
The authors declare no competing interests.
REFERENCES
[1] M. Economidou, V. Todeschi, P. Bertoldi, D. D’Agostino, P. Zangheri, and L. Castellazzi, “Review of 50 years of EU energy efficiency policies for buildings,” Energy Build., vol. 225, p. 110322, Oct. 2020, doi: 10.1016/J.ENBUILD.2020.110322.
[2] S. Saint Akadiri, A. Adewale Alola, G. Olasehinde-Williams, and M. Udom Etokakpan, “The role of electricity consumption, globalization and economic growth in carbon dioxide emissions and its implications for environmental sustainability targets,” Sci. Total Environ., vol. 708, p. 134653, 2020, doi: 10.1016/j.scitotenv.2019.134653.
[3] IEA, “Energy technology perspectives 2020 - Analysis - IEA,” 2020. https://www.iea.org/reports/energy-technology-perspectives-2020
[4] J. Taherahmadi, Y. Noorollahi, and M. Panahi, “Toward comprehensive zero energy building definitions: a literature review and recommendations,” Int. J. Sustain. Energy, vol. 40, no. 2, pp. 120–148, Feb. 2021, doi: 10.1080/14786451.2020.1796664.
[5] C. Marincu, D. Dan, and L. Moga, “Investigating the influence of building shape and insulation thickness on energy efficiency of buildings,” Energy Sustain. Dev., vol. 79, p. 101384, Apr. 2024, doi: 10.1016/J.ESD.2024.101384.
[6] Um-e-Habiba, I. Ahmed, M. Asif, H. H. Alhelou, and M. Khalid, “A review on enhancing energy efficiency and adaptability through system integration for smart buildings,” J. Build. Eng., vol. 89, p. 109354, Jul. 2024, doi: 10.1016/J.JOBE.2024.109354.
[7] R. A. Mangkuto et al., “Experiment and simulation to determine the optimum orientation of building-integrated photovoltaic on tropical building façades considering annual daylight performance and energy yield,” Energy Built Environ., vol. 5, no. 3, pp. 414–425, Jun. 2024, doi: 10.1016/J.ENBENV.2023.01.002.
[8] C. A. Riascos-González, P. Thomson, and S. Dyke, “Evaluación del desempeño de un amortiguador de masa sintonizado no lineal mediante simulaciones híbridas en tiempo real,” Inge CuC, vol. 15, no. 2 SE-, pp. 11–22, Sep. 2019, doi: 10.17981/ingecuc.15.2.2019.02.
[9] M. Á. Ospina García, S. B. Chaves Pabon, L. Á. Moreno Anselmí, L. Patarroyo Arias, and M. R. Pérez Castro, “Análisis de las propiedades físicas y mecánicas del adobe con asfalto reciclado,” Inge CuC, vol. 16, no. 2, pp. 86–103, May 2020, doi: 10.17981/10.17981/ingecuc.16.2.2020.06.
[10] M. Balbis-Morejón, J. M. Rey-Hernández, C. Amaris-Castilla, E. Velasco-Gómez, J. F. San José-Alonso, and F. J. Rey-Martínez, “Experimental Study and Analysis of Thermal Comfort in a University Campus Building in Tropical Climate,” Sustainability, vol. 12, no. 21, p. 8886, Oct. 2020, doi: 10.3390/su12218886.
[11] E. Benedicta Kyere, T.-C. Jen, L. Tartibu, and B. Tien-Chien Jen, “Analysis of the Influence of Chilled Water Temperature Setpoint on Thermal Comfort and Energy Consumption,” Arab. J. Sci. Eng., p. 21, 2023, doi: 10.1007/s13369-023-08350-2.
[12] A. Labihi, Y. Benakcha, A. Meslem, P. Byrne, and F. Collet, “Improving the ventilation of a classroom to achieve heating energy savings and better indoor air quality,” Build. Serv. Eng. Res. Technol., vol. 45, no. 3, pp. 275–291, 2024, doi: 10.1177/01436244241233756.
[13] J. Cardenas, G. Osma, and G. Ordoñez, “Herramienta metodológica para la evaluación energética mediante simulación de edificaciones en el trópico,” UIS Ing., vol. 18, no. 2, pp. 1–10, 2019, doi: 10.18273/revuin.v18n2-2019024.
[14] D. Bortolassi, F. · Felipe, L. Coelho Da Silva, and F. L. Coelho Da Silva, “A study on the prediction of electricity consumption considering the energy efficiency measures-applied in case of the Brazilian public sector,” Energy Effic., vol. 16, p. 94, 2023, doi: 10.1007/s12053-023-10160-2.
[15] J. Zhan, W. He, and J. Huang, “Comfort, carbon emissions, and cost of building envelope and photovoltaic arrangement optimization through a two-stage model,” Appl. Energy, vol. 356, p. 122423, Feb. 2024, doi: 10.1016/J.APENERGY.2023.122423.
[16] Y. Kang et al., “Integrated passive design method optimized for carbon emissions, economics, and thermal comfort of zero-carbon buildings,” Energy, vol. 295, p. 131048, May 2024, doi: 10.1016/J.ENERGY.2024.131048.
[17] R. Chen and Y. S. Tsay, “Carbon emission and thermal comfort prediction model for an office building considering the contribution rate of design parameters,” Energy Reports, vol. 8, pp. 8093–8107, Nov. 2022, doi: 10.1016/J.EGYR.2022.06.012.
[18] H. Jun and H. Fei, “Research on multi-objective optimization of building energy efficiency based on energy consumption and thermal comfort,” Build. Serv. Eng. Res. Technol., 2024, doi: 10.1177/01436244241240066.
[19] H. Wei, Y. Jiao, Z. Wang, W. Wang, and T. Zhang, “Optimal retrofitting scenarios of multi-objective energy-efficient historic building under different national goals integrating energy simulation, reduced order modelling and NSGA-II algorithm,” Build. Simul., pp. 1–22, 2024, doi: 10.1007/s12273-024-1122-9.
[20] H. Alhaidary, A. K. Al-Tamimi, and H. Al-Wakil, “The combined use of BIM, IR thermography and HFS for energy modelling of existing buildings and minimising heat gain through the building envelope: a case-study from a UAE building,” Adv. Build. Energy Res., vol. 15, no. 6, pp. 709–732, Nov. 2021, doi: 10.1080/17512549.2019.1703812.
[21] F.-Z. El-Bichri, I. Sobhy, I. Bouchefra, B. Benhamou, H. Chehouani, and M. O. Mghazli, “Assessment of the impact of construction materials on the building’s thermal behaviour and indoor thermal comfort in a hot and semi-arid climate,” Adv. Build. Energy Res., vol. 16, no. 6, pp. 711–735, Nov. 2022, doi: 10.1080/17512549.2022.2096692.
[22] F. W. Yu and W. T. Ho, “Optimizing hybrid ventilation and daylight-linked dimming control for carbon reduction and thermal comfort in a subtropical high-rise office building,” Clean. Energy Syst., vol. 7, p. 100096, Apr. 2024, doi: 10.1016/J.CLES.2023.100096.
[23] Y. Tan, J. Peng, M. Wang, Y. Luo, A. Song, and N. Li, “Comfort assessment and energy performance analysis of a novel adjustable semi-transparent photovoltaic window under different rule-based controls,” Build. Simul., vol. 16, no. 12, pp. 2343–2361, 2023, doi: 10.1007/s12273-023-1011-7.
[24] H. Hosamo, M. H. Hosamo, H. K. Nielsen, P. R. Svennevig, and K. Svidt, “Digital Twin of HVAC system (HVACDT) for multiobjective optimization of energy consumption and thermal comfort based on BIM framework with ANN-MOGA,” Adv. Build. Energy Res., vol. 17, no. 2, pp. 125–171, Mar. 2023, doi: 10.1080/17512549.2022.2136240.
[25] F. Faridah, S. S. Utami, D. D. A. Wijaya, R. J. Yanti, W. S. Putra, and B. Adrian, “An indoor airflow distribution predictor using machine learning for a real-time healthy building monitoring system in the tropics,” Build. Serv. Eng. Res. Technol., vol. 45, no. 3, pp. 293–315, 2024, doi: 10.1177/01436244241231354.
[26] A. Romero-Acero, A. Marín-Cano, and J. A. Jiménez Builes, “Modelo de interconectividad ZigBee & Wi-Fi para el control de un sistema inteligente de iluminación tipo LED usando IoT,” Inge CuC, vol. 17, no. 1 SE-, pp. 146–155, Jan. 2021, doi: 10.17981/ingecuc.17.1.2021.11.
[27] P. Wang, J. Hu, and W. Chen, “A hybrid machine learning model to optimize thermal comfort and carbon emissions of large-space public buildings,” J. Clean. Prod., vol. 400, p. 136538, May 2023, doi: 10.1016/J.JCLEPRO.2023.136538.
[28] S. Salimi, E. Estrella Guillén, and H. Samuelson, “Decoupling awake and asleep thermal comfort: Impact on building design optimization,” J. Build. Eng., vol. 82, p. 108183, Apr. 2024, doi: 10.1016/J.JOBE.2023.108183.
[29] L. Vandenbogaerde, S. Verbeke, and A. Audenaert, “Optimizing building energy consumption in office buildings: A review of building automation and control systems and factors influencing energy savings,” J. Build. Eng., vol. 76, p. 107233, Oct. 2023, doi: 10.1016/J.JOBE.2023.107233.
[30] J. M. Han et al., “Data-informed building energy management (DiBEM) towards ultra-low energy buildings,” Energy Build., vol. 281, p. 112761, Feb. 2023, doi: 10.1016/J.ENBUILD.2022.112761.
[31] S. Salimi and A. Hammad, “Optimizing energy consumption and occupants comfort in open-plan offices using local control based on occupancy dynamic data,” Build. Environ., vol. 176, p. 106818, Jun. 2020, doi: 10.1016/J.BUILDENV.2020.106818.
[32] Y. Pan et al., “Building energy simulation and its application for building performance optimization: A review of methods, tools, and case studies,” Adv. Appl. Energy, vol. 10, p. 100135, Jun. 2023, doi: 10.1016/J.ADAPEN.2023.100135.
[33] J. Park, J. Woo, and T. Jin, “Assessing electricity reduction program under the presence of the other energy saving programs using quasi-experimental design: a case study of South Korea,” Energy Effic., vol. 16, p. 9, 2023, doi: 10.1007/s12053-023-10094-9.
[34] M. Mišík, V. Oravcová, and R. Vicenová, “Energy efficiency of buildings in Central and Eastern Europe: room for improvement,” Energy Effic., vol. 17, p. 32, 2024, doi: 10.1007/s12053-024-10215-y.
[35] N. Jurišević, D. Gordić, N. Lukić, and M. Josijević, “Benchmarking heat consumption in educational buildings in the city of Kragujevac (Serbia),” Energy Effic., vol. 11, pp. 1023–1039, 2018, doi: 10.1007/s12053-018-9631-y.
[36] Google, “London Business School,” Google Map, 2024. https://www.google.com/maps/place/London+Business+School/@51.5261617,-0.1633234,17z/data=!3m1!4b1!4m6!3m5!1s0x48761ac6309dd51b:0xbf9c52f1c02b7723!8m2!3d51.5261617!4d-0.1607485!16zL20vMDJremZ3?hl=es&entry=ttu
[37] MetOffice, “UK Meteorological Office,” 2023. https://www.metoffice.gov.uk/
[38] IES, “Integrated Environmental Solutions (IES),” 2023. https://www.iesve.com/
[39] ASHRAE, “Standard 100-2024 -- Energy and Emissions Building Performance Standard for Existing Buildings,” 2024. [Online]. Available: https://www.techstreet.com/ashrae/standards/ashrae-100-2024?product_id=2579183
[40] CIBSE, “Guide B: Heating, Ventilating, Air Conditioning and Refrigeration,” 2016. [Online]. Available: https://www.cibse.org/knowledge-research/knowledge-resources/engineering-guidance/cibse-guides
[41] G. of UK, “Conservation of fuel and power: Approved Document L.,” 2023. [Online]. Available: https://www.gov.uk/government/publications/conservation-of-fuel-and-power-approved-document-l
[42] H. and C. Department for Levelling Up, “National Calculation Methodology (NCM) modelling guide (for buildings other than dwellings in England). 2021 edition,” 2022. [Online]. Available: https://cis.ihs.com/CIS/document/339220
[43] R. Hesse et al., “Low global-warming-potential refrigerant CH2F2 (R-32): Integration of a radiation heat loss correction method to accurately determine experimental flame speed metrics,” Proc. Combust. Inst., vol. 38, no. 3, pp. 4665–4672, Jan. 2021, doi: 10.1016/J.PROCI.2020.05.026.
[44] CIBSE, “Guide A: Environmental Design,” 2015. [Online]. Available: https://www.cibse.org/knowledge-research/knowledge-portal/guide-a-environmental-design-2015
[45] G. of UK, “Conservation of fuel and power: Approved Document L. Volume 2: Buildings other than dwellings,” 2021. [Online]. Available: https://assets.publishing.service.gov.uk/media/63d8edbde90e0773d8af2c98/Approved_Document_L__Conservation_of_fuel_and_power__Volume_2_Buildings_other_than_dwellings__2021_edition_incorporating_2023_amendments.pdf
[46] I. S. Organization, “ISO 7730: Ergonomics of the thermal environment,” 2005. [Online]. Available: https://www.iso.org/standard/39155.html
[47] CIBSE, “Guide F: Energy efficiency in buildings,” 2012. [Online]. Available: https://www.cibse.org/knowledge-research/knowledge-portal/guide-f-energy-efficiency-in-buildings-2012
[48] C. and L. G. Ministry of Housing, “Display Energy Certificates (DECs),” Government of UK, 2022. https://find-energy-certificate.service.gov.uk/find-a-non-domestic-certificate/search-by-postcode?postcode=NW1+4SA
[49] ASHRAE, “Standard 62.1-2019: Ventilation for Acceptable Indoor Air Quality,” 2019. [Online]. Available: https://www.ashrae.org/technical-resources/bookstore/standards-62-1-62-2
[50] ASHRAE, “Standard 34-2019, Designation and Safety Classification of Refrigerants,” 2019. [Online]. Available: https://www.ashrae.org/technical-resources/standards-and-guidelines/standards-addenda/addenda-to-standard-34-2019
[51] I. S. Organization, “ISO 9869-1: Thermal insulation — Building elements — In-situ measurement of thermal resistance and thermal transmittance,” 2014. [Online]. Available: https://www.iso.org/standard/59697.html
[52] I. E. Agency, “IEA PVPS Task 15, Integrating Photovoltaic Systems in Buildings, Photovoltaic Power Systems Programme,” 2021. [Online]. Available: https://iea-pvps.org/research-tasks/enabling-framework-for-the-development-of-bipv/
[53] I. S. Organization, “ISO 50001: Energy management systems — Requirements with guidance for use,” 2018. [Online]. Available: https://www.iso.org/iso-50001-energy-management.html
[54] UNESCO, “Education for Sustainable Development Goals: Learning Objectives,” 2017. [Online]. Available: https://unesdoc.unesco.org/ark:/48223/pf0000247444
[55] CIBSE, “TM54, Evaluating operational energy performance of buildings at the design stage,” 2013. [Online]. Available: https://www.cibse.org/knowledge-research/knowledge-portal/tm54-evaluating-operational-energy-use-at-the-design-stage-2022
Carlos Amaris-Castilla. Universidad Industrial de Santander. Bucaramanga, Santander (Colombia). https://orcid.org/0000-0002-0571-282X
Daniele Tino. Hoare Lea. Bristol, (Ucrania). https://orcid.org/0009-0005-7686-7481